
Martin Grandjean, ein Schweizer Historiker und Digital-Humanities-Wissenschaftler sowie Experte für Netzwerkanalysen und ‑visualisierungen, hat sich die elf Tragödien Shakespeares vorgenommen:
Are Shakespeare’s tragedies all structured in the same way? Are the characters rather isolated, grouped, all connected?
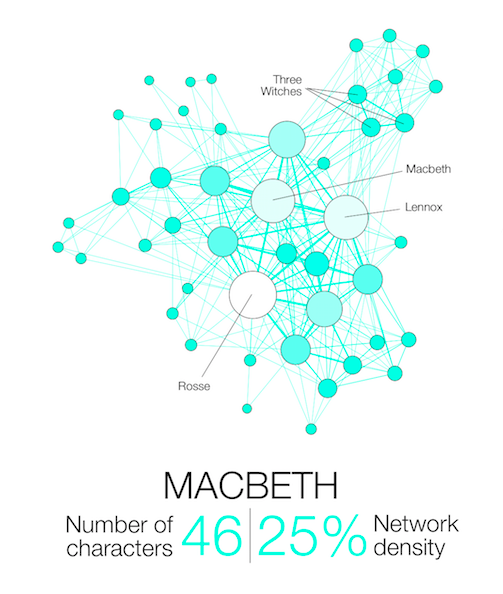
Narration, even fictional, contains a network of interacting characters. Constituting a well defined corpus, the eleven Shakespearean tragedies can easily be compared: We propose here a network visualization in which each character is represented by a node connected with the characters that appear in the same scenes.
The result speaks for itself: the longest tragedy (Hamlet) is not the most structurally complex and is less dense than King Lear, Titus Andronicus or Othello. Some plays reveal clearly the groups that shape the drama: Montague and Capulets in Romeo and Juliet, Trojans and Greeks in Troilus and Cressida, the triumvirs parties and Egyptians in Antony and Cleopatra, the Volscians and the Romans in Coriolanus or the conspirators in Julius Caesar.
Für die Visualisierungen gilt:
Two characters are connected if they appear in the same scene.
Their size and color intensity are proportional to their weighted degree.
The ‘network density’ measures how close the graph is to complete. A complete graph (100%) has all possible edges between its nodes.
Im Blogpost zu diesem Projekt können Sie ein Poster mit allen elf Grafiken downloaden.
In seinem Blog finden Sie viele weitere Visualisierungen.
Martin Grandjean ist unter @GrandjeanMartin übrigens auch auf Twitter zu finden.